
The Proven Unknown
What Six Oil Majors Say (and Don't Say) in Their 10-Ks/20-Fs

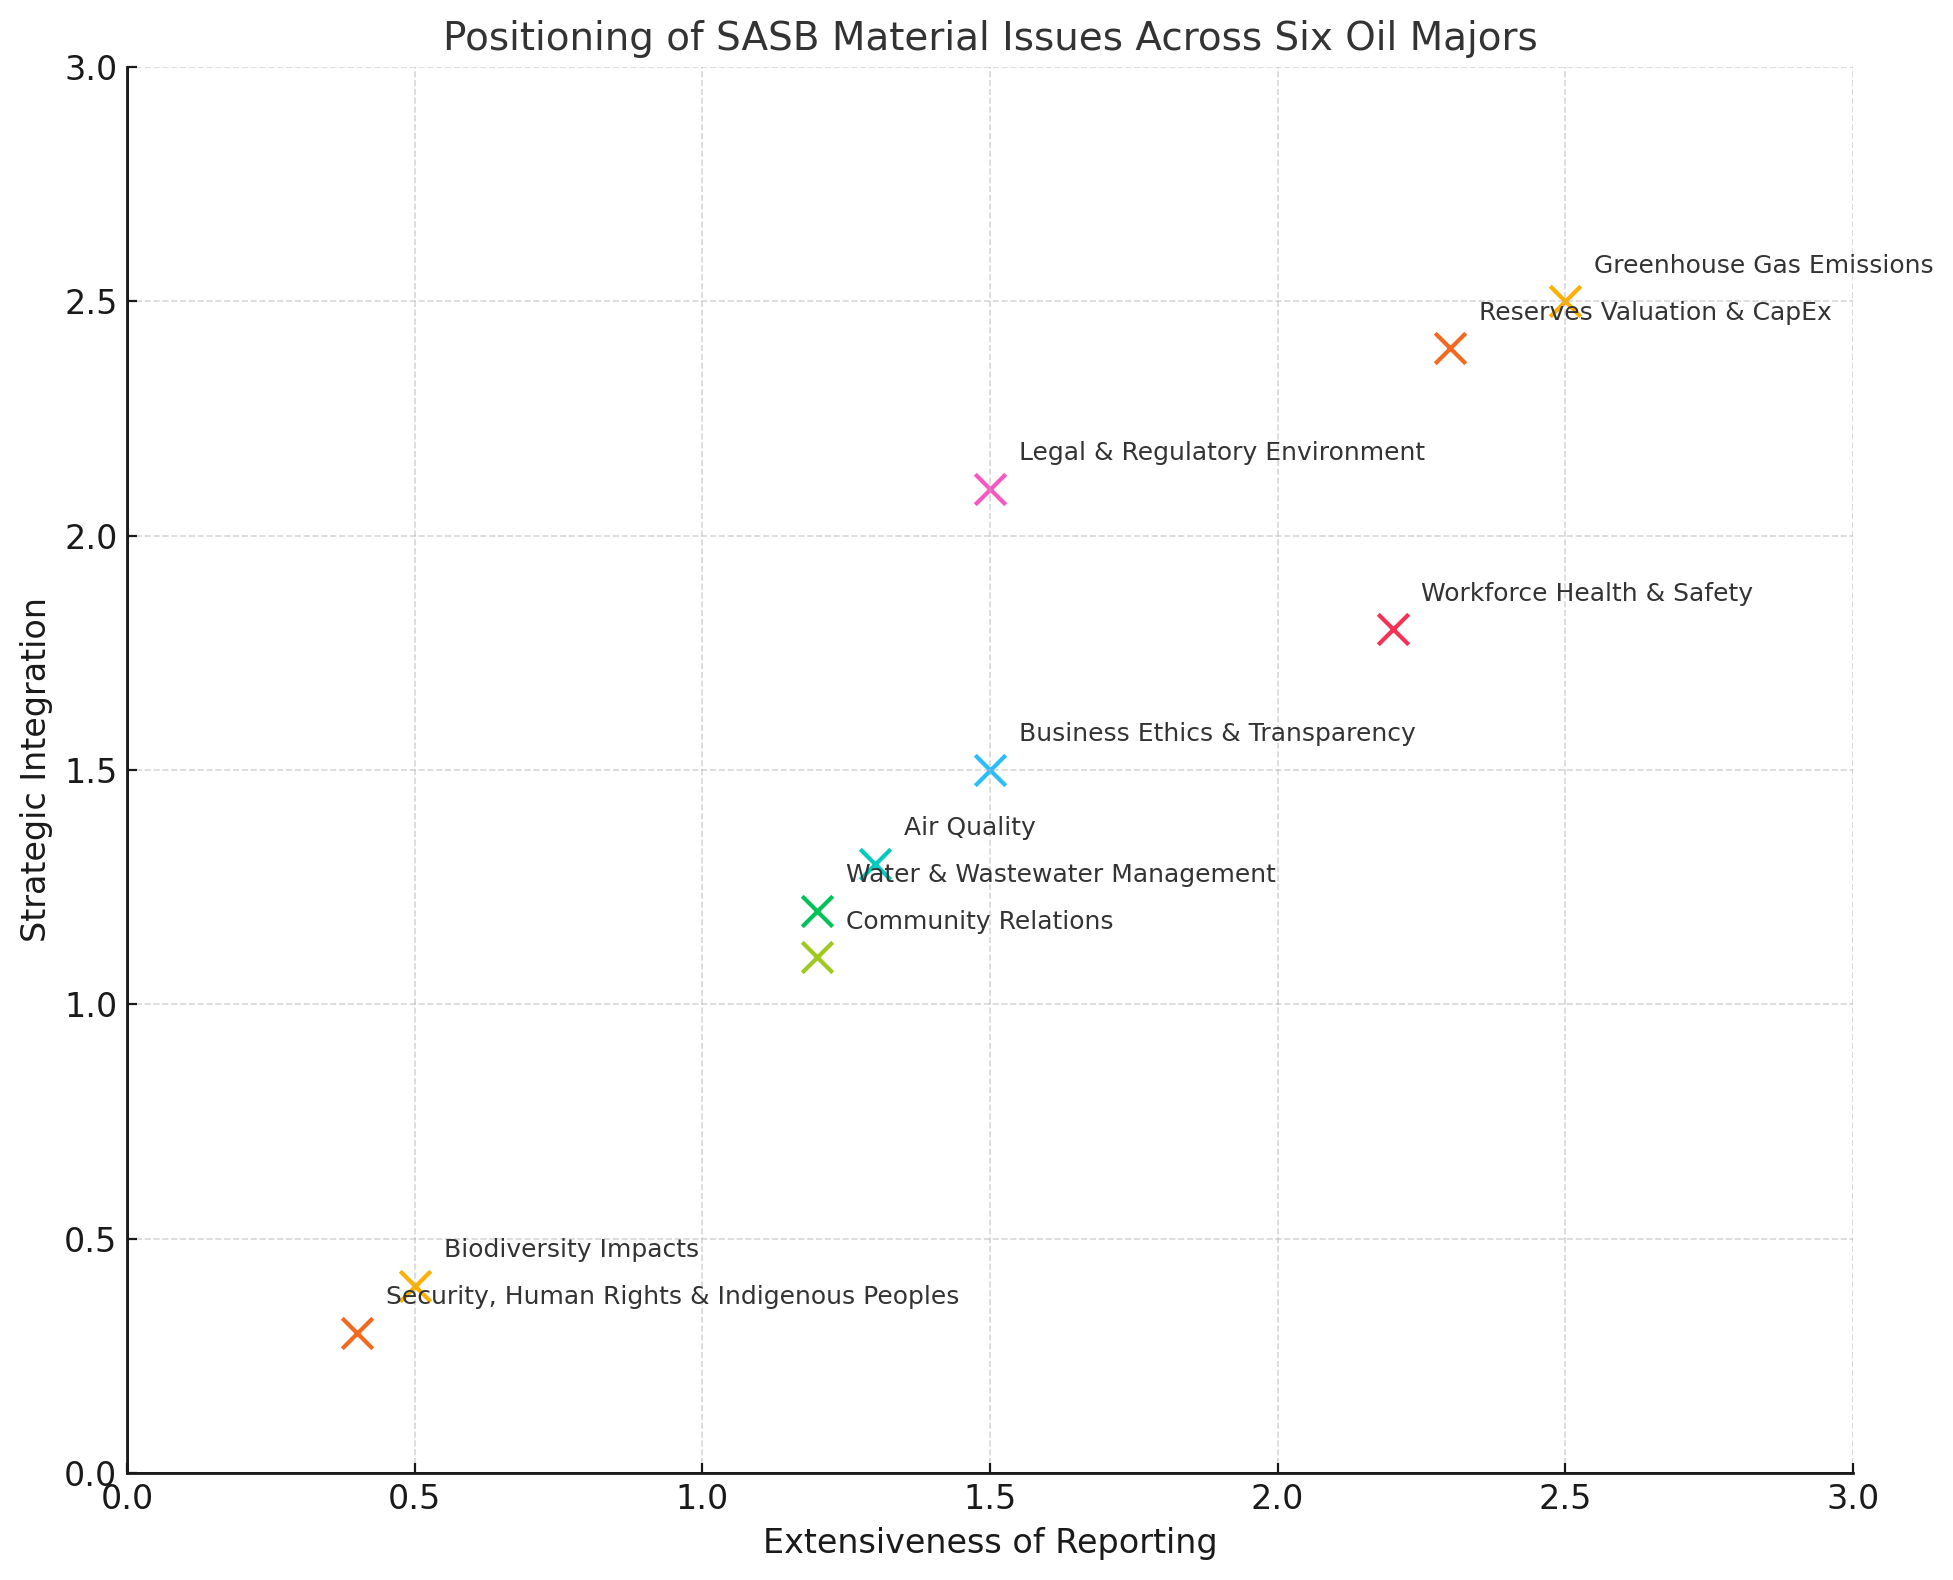
Last week I published on Forbes.com “Does Sustainability Matter To The Oil And Gas Industry?” The basis of the piece was a simple idea. I had Dorothy ChatGPT analyze the 2024 10-Ks of Chevron, ConocoPhillips, and ExxonMobil and the 2024 20-Fs of bp, Shell, and TotalEnergies from the perspective of their disclosures according to the 10 material issues for this industry as identified by SASB. Below is how Dorothy placed them in a chart with one axis being extent of disclosure (e.g., how much) and the other integration to corporate strategy (e.g., how well). (Forbes.com doesn’t permit the use of AI generated images. I find this a little bizarre. What’s the problem with an AI-generated image if it has full disclosure?) An obvious takeaway is that while all SASB material issues are being reported, the quality varies substantially, suggesting that materiality is not a binary concept. The top two, unsurprisingly, are GHG Emissions and Reserves Valuation/CapEx.
LinkedIn Comments
As with all my pieces, I posted it on LinkedIn. There was a wide range of opinions from people thinking this was interesting and useful exercise to others expressing skepticism about AI and whether the results were meaningful or not (including some good friends!) A few people wondered why I picked the name Dorothy. That will become clear later this year when I publish Dorothy and Me: A Personal Memoir about My Relationship with a Machine. It’s a quirky and weird little book but not in the ways you’d expect from the title.
Climate Disclosure and Strategic Signaling in the Oil & Gas Sector
I’m not very good (terrible, in fact) at responding to individual comments on LinkedIn. But I do read them carefully and think about what I’ve learned and what next steps I could take from this. The result this time was an intense day on July 19, 2025, where I worked with Dorothy, Claude, and Perplexity. (Some of the comments were skeptical about Dorothy in particular and said other agents, Perplexity, being the named one, were better and had fewer hallucinations.) In the first step I told Dorothy to go back through these formal filing documents and focus on GHG Emissions and Reserves Valuation/CapEx from the perspective of an investor. What is the quality of these disclosures, how could they be improved and how hard would that be? We produced a full report “Climate Disclosure and Strategic Signaling in the Oil & Gas Sector: A Comparative Analysis of Six Majors, With a Methodological Focus on AI-Augmented Narrative Inquiry.” You can make your own judgement of the quality of our analysis, AI-aided or not as you see fit!
Section 1 explains the methodology and how Dorothy and I worked together to produce this report. In essence, we went through multiple iterations to structure the report, she did the writing which I reviewed and provided feedback and edits. I challenged her on certain framings (like a rank-order table she put together), and I checked on some things to make sure she got it right based on my own knowledge of particular companies (i.e., ExxonMobil where I’ve read every single sustainability-related disclosure I could find which is a lot). I didn’t do my own validation of links to the formal filings. If I could easily do this, what do I need her for, right?

Working with Multiple AI Agents
In this piece I will focus on aggregate industry results based on these six companies. More detail on the individual companies will be provided in subsequent pieces. These are based on sharing this report with Claude and Perplexity where I asked them for their views on the strengths and weaknesses of this report and suggestions for improvement. I also had them do their own analysis in various ways. More to come on this.
GHG Emissions
While there were variations across the three companies, particularly in Scope 3 reporting and various degrees of target setting, there were four dimensions where all companies were at least acknowledging important issues:
1. Universal Scope 1 & 2 Reporting
All six companies provide Scope 1 and Scope 2 emissions data, typically broken down by business segment or geography and presented in both absolute and intensity-adjusted terms. This now constitutes a baseline expectation for oil and gas majors.
2. Emissions Targets and Long-Term Ambitions
Each company has disclosed at least a net-zero by 2050 goal for Scope 1 and 2, with several offering intermediate 2030 targets. Some, like bp and TotalEnergies, also reference Scope 3 in these ambitions.
3. Governance Acknowledgement
Most firms state that climate risk, including emissions strategy, is subject to board-level oversight or tied to executive compensation. This is becoming standard language in financial filings.
4. Carbon Pricing Mentioned (if not Detailed)
All companies reference internal carbon pricing, shadow pricing, or external regulatory risk — though with varying degrees of specificity. At minimum, they acknowledge it as a planning variable.
Scope 1 and 2 reporting is pretty well defined although it’s fair to ask how detailed the companies are in terms of measurement and whether any assurance is given. The credibility of targets is heavily influenced by how much explanation is provided on how they will be achieved. This is kind of detail isn’t something you’ll find in a 10-K/20-F. While having governance acknowledgment is good, the real issue is whether this is meaningful or just a “tick-the-box” exercise. Finally, carbon pricing is obviously the most loaded topic of all. I’m a big fan of this as written about here. While reporting and targets are important, I think it’s only by getting a price on carbon that we can really move the needle and I’ve written about that here.
There were also some notable weaknesses and for me these are more important than the commonalities.
1. Scope 3 Avoidance or Minimalism
With the exception of TotalEnergies and, to a lesser extent, bp and ConocoPhillips, Scope 3 remains an avoided or underexplained dimension — especially in statutory filings. U.S. firms largely sidestep responsibility, framing it as downstream demand they do not control.
2. Emissions/CapEx Linkages are Thin
No company quantitatively ties emissions reduction targets to CapEx shifts, margin impact, or EBITDA projections in the 10-K or 20-F. These linkages are hinted at in strategy documents but are largely absent in filings.
3. No Capital-Weighted Emissions Analysis
Investors cannot readily determine which capital-intensive segments carry the highest emissions exposure, or how that is factored into investment decisions.
4. Over-Reliance on Long-Term Commitments
2050 targets are common — but short-term operational milestones (e.g., by 2025 or 2030) are rare and often lack specificity, making investor monitoring difficult.

I asked Dorothy for her assessment of the degree of difficulty for companies to close these gaps if they were interested in doing so. Here’s her opinion and I can already hear echoes of people calling this a PowerPoint slide with no meat on the bones. You can decide for yourself but these ring true to me. The most important ones are the hard ones, linking emissions to capex strategy and segment level emissions with ROI overlay. These issues are at the core of the integration of sustainability into corporate strategy as well as how the company views its role in climate change and the energy transition.
Degree of Difficulty to Improve GHG Emissions Disclosures
| Disclosure Element | Difficulty | Notes |
|-----------------------------------|------------|-------------------------------------------------------------------|
| Scope 3 Quantification (Sold Products) | 🟡 Moderate | Requires value chain modeling, but already done by some peers |
| Internal Carbon Pricing Disclosure | 🟢 Easy | Most firms mention this; publishing numbers is a simple decision |
| Linking Emissions to CapEx Strategy | 🔴 Hard | Requires internal process changes and willingness to share logic |
| Short-Term Targets with Metrics | 🟢 Easy–Moderate | Technically simple but may reveal lack of real progress |
| Segment-Level Emissions with ROI | 🔴 Hard | Requires integrating sustainability and finance systems |
Reserves Valuations and Capital Expenditures
The same analysis was done for these disclosures. There were three areas of commonality on important topics:
1. Standardized Reserve Disclosure Framework
All six companies provide SEC-compliant disclosure of proved reserves by commodity and geography. This includes volumetric totals, reserve life indices, and reconciliation tables — a well-established and mature disclosure format.
2. Clear CapEx Breakdowns by Business Segment
Each firm offers a segment-by-segment breakdown of CapEx, sometimes supplemented by geographic detail. This supports investor visibility into relative capital allocations across upstream, downstream, and emerging businesses.
3. Some Acknowledgment of Climate-Linked Impairment Risk
Several filings (e.g., TotalEnergies, bp, Shell) mention that long-term demand uncertainty, carbon pricing, or regulatory pressure could trigger impairments, even if the math is not shown.
The first two are driven by regulatory requirement. The third one is a highly contested area where I’ve done some reading but am not an expert. What I do know is that it has become a highly politicized issue in the U.S. with the SEC disclosure rule developed under Chair Gary Gensler now being moot. This issue is of fundamental importance to investors and so we’re in a struggle between politics and information investors need to make economic decisions.

Weaknesses outweighed strengths:
1. Absence of Scenario-Based Stress Testing
No company explicitly models how reserves or CapEx performance would shift under climate-aligned price scenarios (e.g., IEA Net Zero, $40 oil). This is a major blind spot for risk-adjusted capital allocation.
2. Lack of Climate Classifications for CapEx
Companies do not categorize CapEx into "green", "transitional", or "legacy fossil" buckets. Investors can’t see how capital is being rebalanced for energy transition resilience.
3. No Transparency on CapEx Hurdle Rate Adjustments
While all companies reference capital discipline, none disclose how (or if) hurdle rates are adjusted for climate risk. This obscures the link between capital allocation and transition planning.
4. Minimal Insight into Carbon Cost Impacts
Internal carbon pricing is occasionally mentioned (e.g., ExxonMobil, TotalEnergies) but rarely quantified or shown as influencing investment viability. This undermines credibility on transition-aligned planning.
Once again capex looms large. Investments in the oil and gas industry are massive, risky, and very long-term. Too much and the company may have a stranded assets problem down the road. Too little and it isn’t delivering the shareholder returns it could. What makes this so complicated is the number of variables that will determine the degree of stranding from new technologies to government policies to dramatic world events like wars. Investors recognize this uncertainty but want to know how companies are thinking about it. One thing I wonder about here is the balance between investor interest and revealing information that can lead to competitive disadvantage.
Dorothy made the same assessment regarding the difficult of providing this information. Agan, I’m no expert on this industry but I wonder just how useful scenario-based reserve stress testing and risk-adjusted value maps by segment would be given the number of assumptions that would have to be made, but others will know better.
Degree of Difficulty in Improving Reserves Valuation and Capital Expenditures’ Disclosures
| Disclosure Element | Difficulty | Notes |
|--------------------------------------|--------------|------------------------------------------------
| Scenario-Based Reserve Stress Testing | 🔴 Hard | Requires modeling, cultural change, and potential investor pushback |
| CapEx Climate Classification | 🟡 Moderate | Already used internally in many cases; just needs external articulation |
| CapEx Hurdle Rate Disclosure | 🟡 Moderate | Sensitive but feasible for selective segments |
| Internal Carbon Price and NPV Impact | 🟡 Moderate | Requires disclosure of existing processes, not new systems |
| Risk-Adjusted Value Maps by Segment | 🔴 Hard | Complex integration of finance and sustainability data |
Was this a useful exercise? It depends on who’s asking. For me, yes, both as a learning experience about the oil and gas industry through the narrow lens of 10-Ks/20-FS and as a lesson in how to collaborate with AI. If you’re similarly curious, maybe it will be for you too.
This is the first of a series of pieces that came out of an interesting day with Dorothy, Claude, and Perplexity. In my next piece I’ll discuss the feedback we got from Claude and Perplexity on our report. There were both similarities and differences and one big surprise.